︎ Campus COVID-19 Dashboard
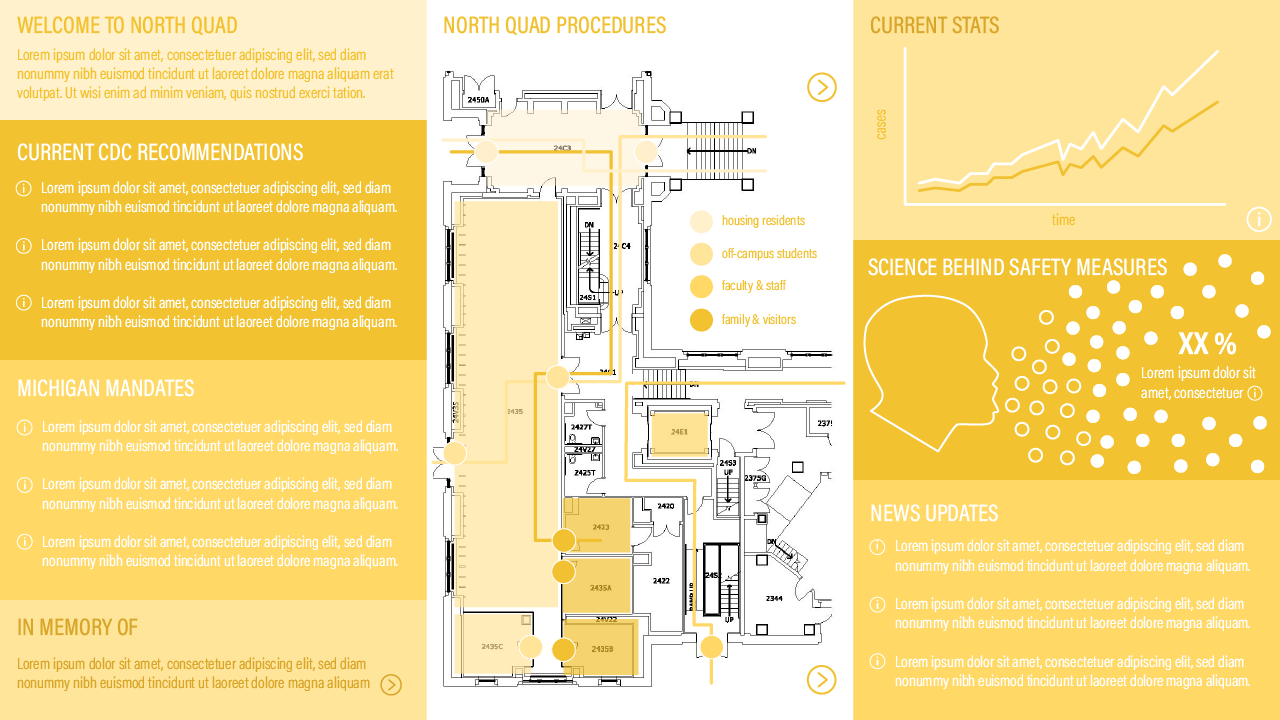
An interactive dashboard that highlights current safety standards and displays data in an empathetic manner.
By Stephanie Schouman ︎


Landing page of dashboard / Schouman 2020
Alongside the COVID-19 global pandemic there has been widespread confusion and misleading information surrounding transmission of the virus, mortality rates, number of cases, and what the general public should do to keep each other safe. Information surrounding the current situation is changing almost every day and it can be difficult to stay informed and know which sources to trust.
When the actions of individuals directly impact the health of the general public, it is also crucial that the data and information being shared highlights the importance of adhering to safety standards in the convincing way With students returning to campus and campus-specific safety measures being put in place, the University of Michigan needs to recognize the need for a centralized space to host health and safety information.
Hypothesis
The University of Michigan should consolidate information, for both campus-specific and nationwide safety recommendations, and create a information hub for students and staff to consume the most relevant COVID-19 related data. This tool should have links to external sources and visualizations to reduce the cognitive load of the viewer. Using compelling visuals and allowing users to validate information, this dashboard can help students and staff feel informed, feel confident in their understanding, and stay safe on campus.
Consolidated Information Elements
One key piece of this tool is gathering and sorting the most relevant and up-to-date information surrounding the virus and the pandemic as a whole.


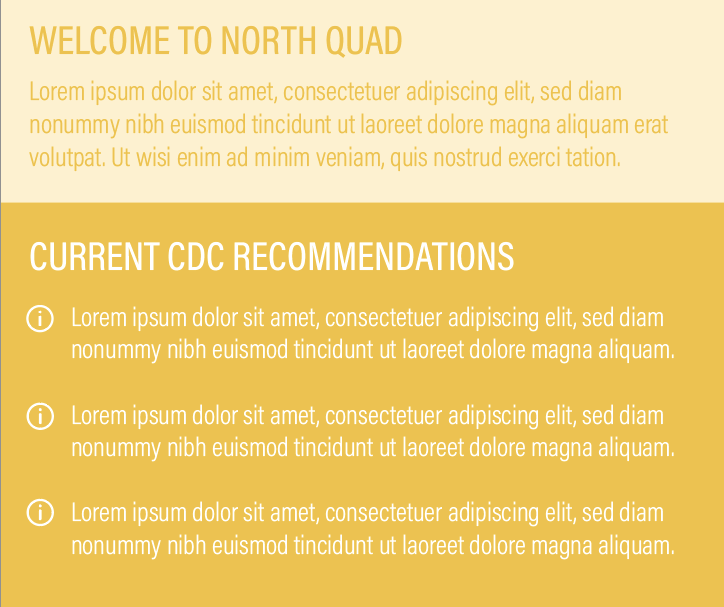
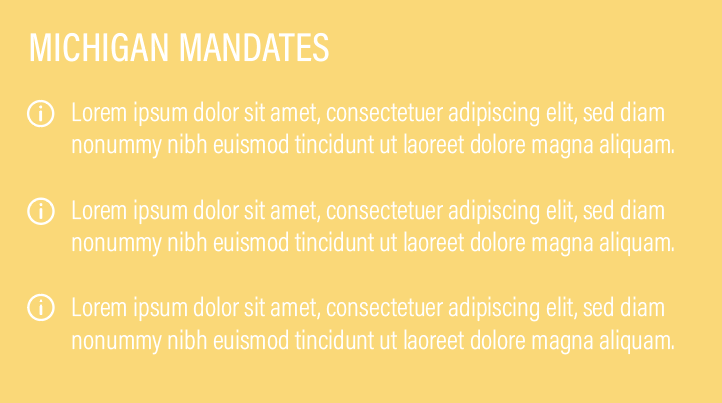
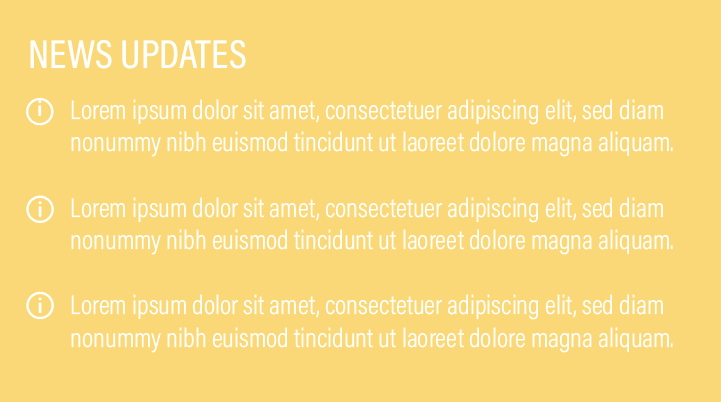
Consolidated Information Panels
By only displaying a few recommendations or safety measures at a time, users are able to quickly and effectively consume this information. The icons to the left of each bullet link to credible sources for users to further validate and explore this information.
Empathetic Data Elements
Qualitative Observations: Caption
Methodology
Lorem Ipsum dolor sit amet, consectetur adipiscing elit, sed do eiusmod tempor incididunt ut labore et dolore magna aliqua. Ut enim ad minim veniam, quis nostrud exercitation ullamco laboris nisi ut aliquip ex ea commodo consequat. Duis aute irure dolor in reprehenderit in voluptate velit esse cillum dolore eu fugiat nulla pariatur. Excepteur sint occaecat cupidatat non proident, sunt in culpa qui officia deserunt mollit anim id est laborum.
Subheading
Lorem Ipsum dolor sit amet, consectetur adipiscing elit, sed do eiusmod tempor incididunt ut labore et dolore magna aliqua. Ut enim ad minim veniam, quis nostrud exercitation ullamco laboris nisi ut aliquip ex ea commodo consequat. Duis aute irure dolor in reprehenderit in voluptate velit esse cillum dolore eu fugiat nulla pariatur. Excepteur sint occaecat cupidatat non proident, sunt in culpa qui officia deserunt mollit anim id est laborum.
<replace video below with your link under ‘code view’>
Design to Outcomes
Lorem Ipsum dolor sit amet, consectetur adipiscing elit, sed do eiusmod tempor incididunt ut labore et dolore magna aliqua. Ut enim ad minim veniam, quis nostrud exercitation ullamco laboris nisi ut aliquip ex ea commodo consequat. Duis aute irure dolor in reprehenderit in voluptate velit esse cillum dolore eu fugiat nulla pariatur. Excepteur sint occaecat cupidatat non proident, sunt in culpa qui officia deserunt mollit anim id est laborum. Closing statement in bold for emphasis.
︎
Works Cited
Jeremy Boy, Anshul Vikram Pandey, John Emerson, Margaret Satterthwaite, Oded Nov, Enrico Bertini. “Showing People Behind Data: Does Anthropomorphizing Visualizations Elicit More Empathy for Human Rights Data?” ACM CHI Conference. 6-11 May 2017.
Kim Bui. “Designing data visualisations with empathy.” DataJournalism.com. 11 June 2019.
Michael Correll. “Ethical Dimensions of Visualization Research.” Tableau Research. ACM CHI Conference. 4-9 May 2019.
Joanna Sleigh, MA; Manuel Schneider, MSc; Julia Amann, PhD; Effy Vayena, PhD. “Visualizing an Ethics Framework: A Method to Create Interactive Knowledge Visualizations From Health Policy Documents.” Journal of Medical Internet Research. 2020.
Alli Torban. “Critiquing data visualizations: A discussion on channeling empathy and productivity.” Tableau Research. 10 May 2019.
Mushon Zer-Aviv. “DataViz - The UnEmpathetic Art.” RD. 2020.